Mastering Python Pandas: A Comprehensive Guide for Data Science Beginners
Unlock the power of Python Pandas! 🐼 Dive into our ultimate guide for data manipulation, analysis, and visualization. Boost your data science skills! 💪 #PandasGuide
Welcome to this beginner-friendly guide to mastering the Python Pandas library for data science!
Pandas is a powerful open-source data analysis and data manipulation library that makes working with structured data easy and efficient.
In this tutorial, we'll walk you through a comprehensive code snippet that demonstrates various Pandas features using a publicly available CSV file. This pandas guide is optimized for SEO keywords like Python, Pandas, DataFrame, and Data Science.
Importing Libraries and Reading CSV Data
To start, we'll import the necessary libraries and read the CSV data from a URL.
Here, we first import the Pandas library as 'pd' and the Matplotlib library as 'plt.' Next, we define the 'url' variable containing the CSV file URL and use the pd.read_csv() function to load the data into a DataFrame called 'df.'
url = "https://raw.githubusercontent.com/CSSEGISandData/COVID-19/master/csse_covid_19_data/csse_covid_19_daily_reports_us/01-01-2021.csv" 
Exploring and Analyzing the Dataset
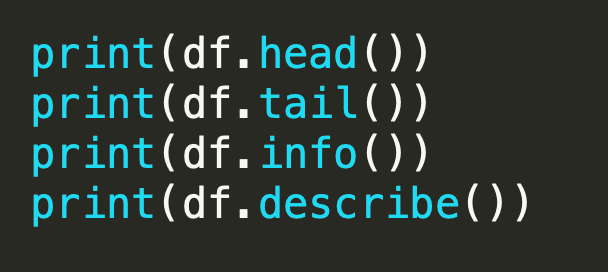
Before diving into data manipulation, it's crucial to explore and understand the dataset.

Above lines of code help you get an overview of the dataset. The head() and tail() functions display the first and last few rows, respectively.
The info() function provides information about the data types, columns, and memory usage.
The describe() function generates summary statistics for numerical columns.
Data Cleaning and Preprocessing
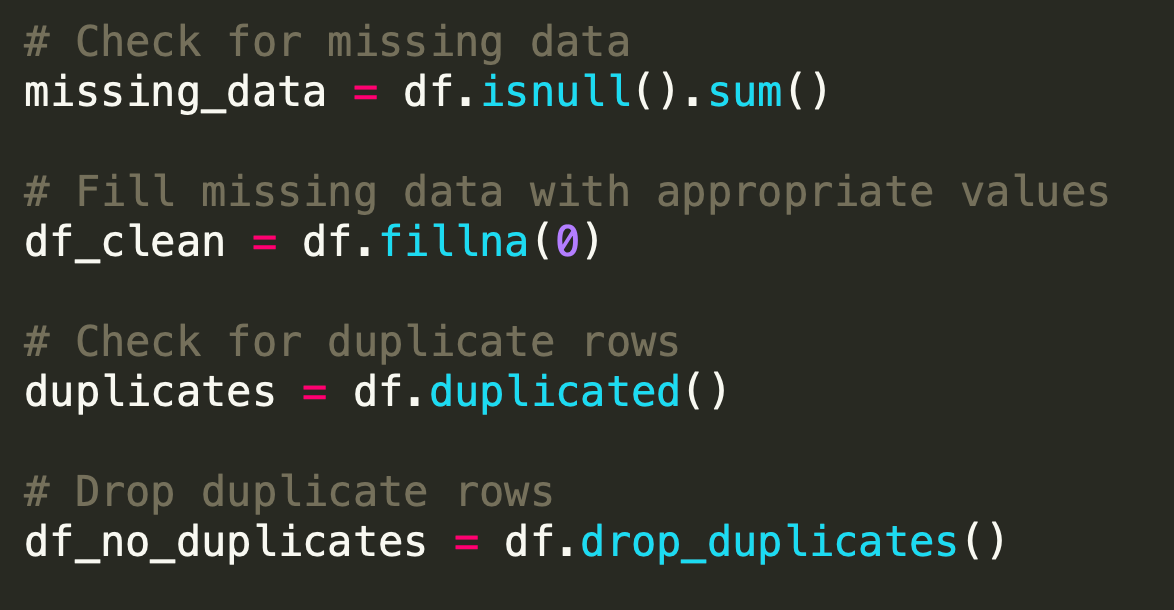
Data cleaning and preprocessing involve handling missing data, data type conversions, and duplicate rows.

Here, we first check for missing data using the isnull() function and then fill missing values with zeros using fillna().
We also check for duplicate rows using duplicated() and drop duplicates with the drop_duplicates() function.
Filtering, Sorting, and Indexing
Learn how to filter data, sort it, and set custom indices.

The code above demonstrates filtering rows based on a condition, sorting the data by the 'Confirmed' column in descending order, and setting a custom index using the 'Province_State' column.
Grouping and Aggregation
Grouping and aggregation help summarize data based on specific conditions.

In the above example, we group data by the 'Country_Region' column and calculate the sum of the remaining columns.
We also demonstrate using the agg() function to apply multiple aggregation functions on the 'Confirmed' column.
Merging, Joining, and Concatenating DataFrames
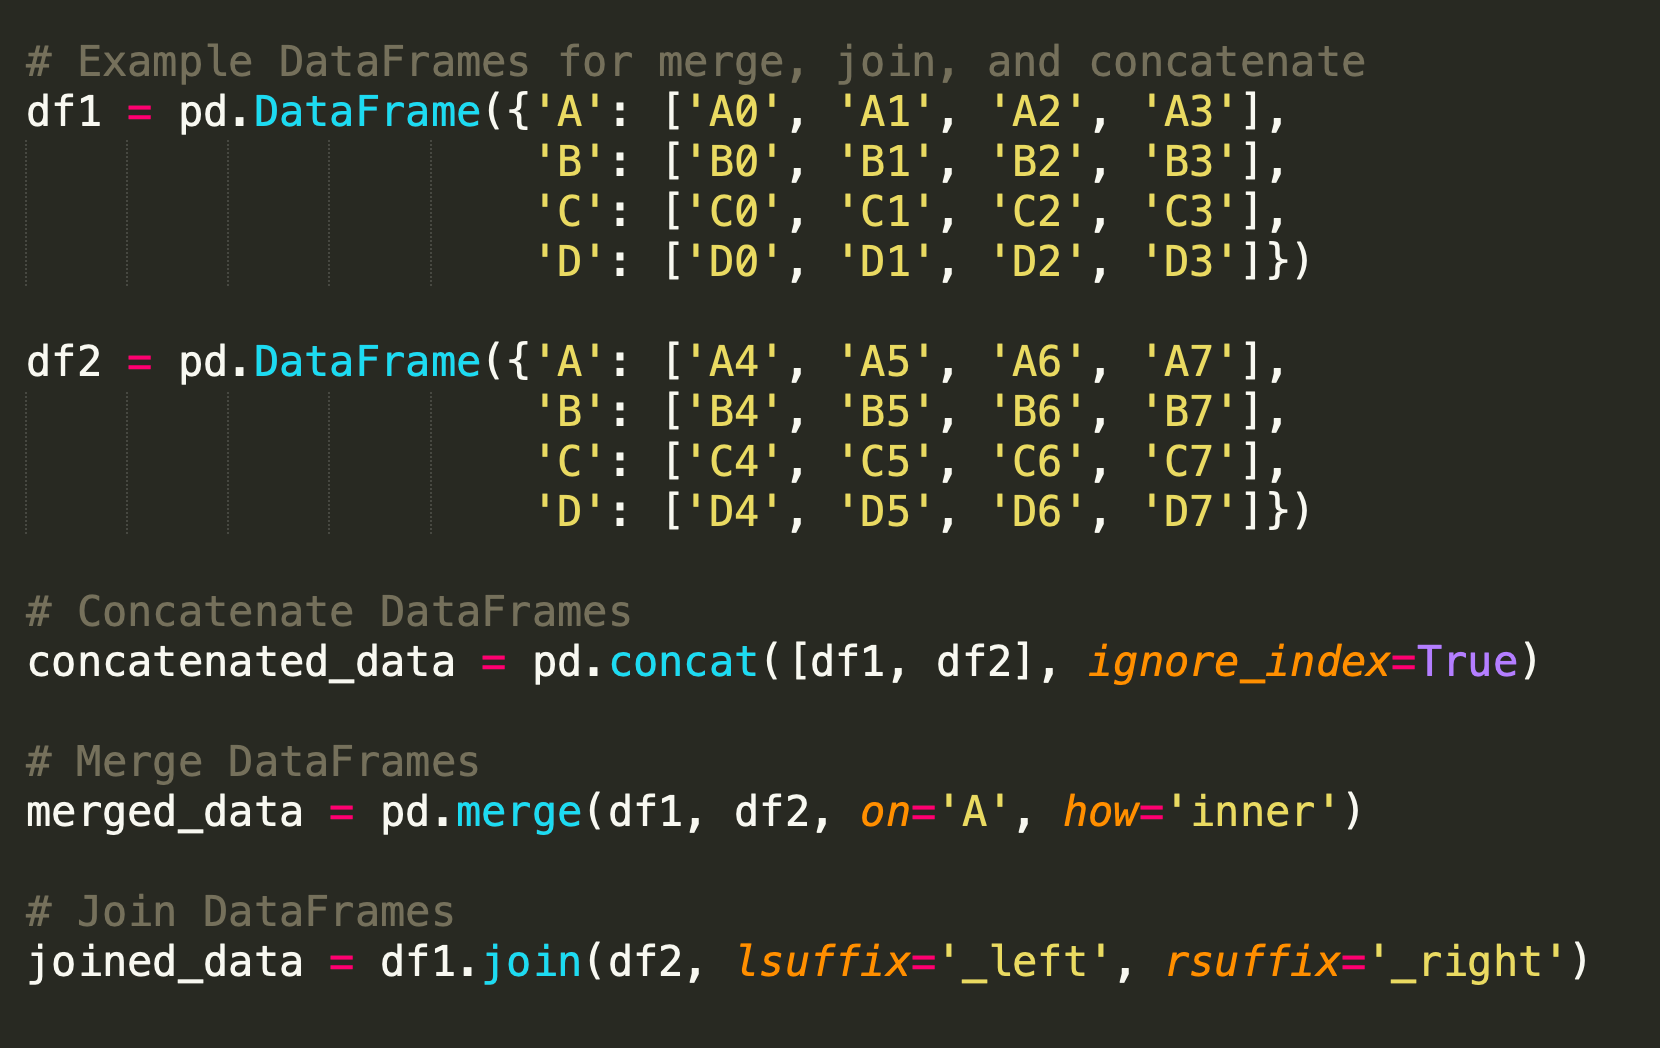
Combine multiple DataFrames using merge, join, and concatenate functions.

In the above snippet section, we create two example DataFrames, 'df1' and 'df2'.
We demonstrate how to concatenate DataFrames using pd.concat(), merge them using pd.merge(), and join them using the join() function.
Reshaping and Pivoting DataFrames
Learn how to reshape and pivot DataFrames to organize data in various formats.

Here, we use the pd.melt() function to reshape the DataFrame, keeping the 'Country_Region' column as identifier variables and melting the 'Confirmed' and 'Deaths' columns.
Then, we use the pivot_table() function to create a pivot table with the 'Country_Region' column as the index.
Visualizing Data Using Pandas
Visualize data using Pandas built-in plotting capabilities.

This code snippet demonstrates how to create a bar chart using the Pandas plot() function. We plot the 'Confirmed' cases for each 'Province_State' and display the plot using plt.show().
Conclusion
In this comprehensive Pandas guide, we've covered various essential features of the Python Pandas library for data science.
We've explored data manipulation, analysis, and visualization using practical examples.
By understanding these concepts, you're well on your way to becoming proficient with the powerful Pandas library in your data science journey!


Comments ()